#!/usr/bin/env python3
# Copyright (C) 2017-2026 elphmod Developers
# This program is free software under the terms of the GNU GPLv3 or later.
import elphmod.models.be
import matplotlib.pyplot as plt
import numpy as np
el, ph, elph = elphmod.models.be.create()
nq = 6
nk = 36
Q = np.array([(Q1, Q2)
for q1 in range(nq)
for q2 in range(nq)
for Q1, Q2 in elphmod.bravais.to_Voronoi(q1, q2, nq)])
shrink_BZ = 1.0 - 1e-10 # q must be within BZ to avoid ambiguity on edge!
q = Q * 2 * np.pi / nq * shrink_BZ
e, U = elphmod.dispersion.dispersion_full_nosym(el.H, nk, vectors=True)
w2, u = elphmod.dispersion.dispersion(ph.D, q, vectors=True)
g2 = elph.sample(q, U=U, u=u, squared=True)[:, 1, :, :, 0, 0]
qxmax = 0.8
qymax = 0.7
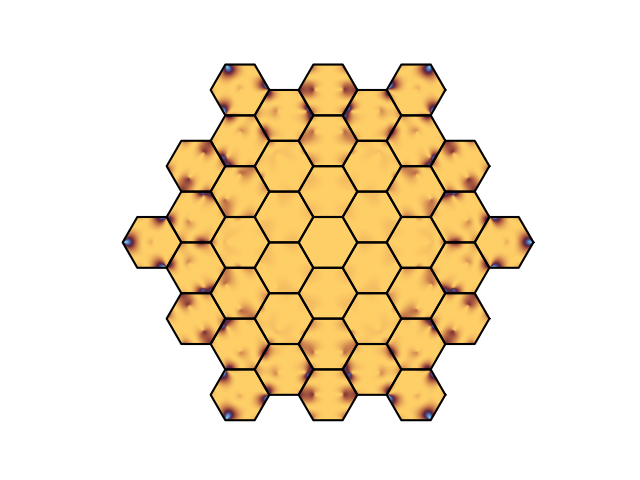
image, BZ = elphmod.plot.double_plot(g2, Q, nq,
qxmin=-qxmax, qxmax=qxmax, qymin=-qymax, qymax=qymax,
outside=np.nan, outlines=True)
if elphmod.MPI.comm.rank == 0:
plt.imshow(image, extent=(-qxmax, qxmax, -qymax, qymax), cmap='managua')
for bz in BZ:
plt.plot(*zip(*bz), 'k')
plt.axis('off')
plt.savefig('double_bz.png')
plt.show()