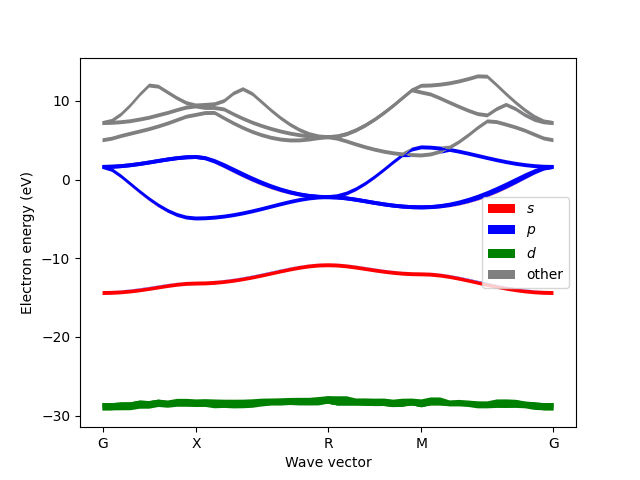
Projected bands (α-Po)
This example shows how to
calculate projections onto (pseudo)atomic orbitals with QE,
plot (and label) the data in atomic_proj.xml as fatbands.
#!/usr/bin/env python3

# Copyright (C) 2017-2026 elphmod Developers
# This program is free software under the terms of the GNU GPLv3 or later.

import elphmod
import matplotlib.pyplot as plt

colors = ['red', 'blue', 'green', 'gray']
labels = ['$s$', '$p$', '$d$', 'other']

x, k, eps, proj = elphmod.el.read_atomic_projections(
    'work/polonium.save/atomic_proj.xml', order=False, other=True)

eps *= elphmod.misc.Ry

orbitals = elphmod.el.read_projwfc_out('projwfc.out')

width = 0.5 * elphmod.el.proj_sum(proj, orbitals, 's', 'p', 'd', 'x')

if elphmod.MPI.comm.rank != 0:
    raise SystemExit

path = 'GXRMG'
K, X, corners = elphmod.bravais.path(path, ibrav=1)
X *= x[-1] / X[-1]

plt.ylabel('Electron energy (eV)')
plt.xlabel('Wave vector')
plt.xticks(X[corners], path)

for n in range(eps.shape[1]):
    fatbands = elphmod.plot.compline(x, eps[:, n], width[:, n, :])

    for fatband, color, label in zip(fatbands, colors, labels):
        plt.fill(*fatband, color=color, linewidth=0.0,
            label=None if n else label)

plt.legend()
plt.savefig('projwfc_3d.png')
plt.show()