#!/usr/bin/env python3
# Copyright (C) 2017-2026 elphmod Developers
# This program is free software under the terms of the GNU GPLv3 or later.
import elphmod
import matplotlib.pyplot as plt
import numpy as np
nu = 1 # displacement direction
use_model = True # or run phrenorm_graphene first
N = [ # 3 x 3 (60 degrees instead of 120 degrees)
[3, 0, 0],
[3, 3, 0],
[0, 0, 1],
]
if use_model:
import elphmod.models.graphene
elphmod.models.graphene.create('data/graphene')
el = elphmod.el.Model('data/graphene')
ph = elphmod.ph.Model('data/graphene.ifc')
elph = elphmod.elph.Model('data/graphene.epmatwp', 'data/graphene.wigner',
el, ph, divide_mass=False)
else:
el = elphmod.el.Model('phrenorm_graphene/graphene')
ph = elphmod.ph.Model('phrenorm_graphene/dfpt.ifc', apply_asr_simple=True)
elph = elphmod.elph.Model('phrenorm_graphene/dfpt.epmatwp',
'phrenorm_graphene/wigner.fmt', el, ph, divide_mass=False)
elph.data *= elphmod.misc.Ry / elphmod.misc.a0
ElPh = elph.supercell(*N, shared_memory=False)
path = 'GMKG'
k, x, corners = elphmod.bravais.path(path, ibrav=4, N=300)
K = np.dot(np.dot(k, elphmod.bravais.reciprocals(*elph.ph.a)), ElPh.ph.a.T)
I = elphmod.MPI.comm.Split(elphmod.MPI.comm.rank)
def g(k1=0.0, k2=0.0, k3=0.0):
return elph.g(q1=0.0, q2=0.0, q3=0.0, k1=k1, k2=k2, k3=k3,
comm=I)[nu]
def G(K1=0.0, K2=0.0, K3=0.0):
return ElPh.g(q1=0.0, q2=0.0, q3=0.0, k1=K1, k2=K2, k3=K3,
comm=I)[nu::ph.size].sum(axis=0)
g, u = elphmod.dispersion.dispersion(g, k, vectors=True)
G, U = elphmod.dispersion.dispersion(G, K, vectors=True)
w = np.ones(g.shape)
W = elphmod.dispersion.unfolding_weights(k, ElPh.cells, u, U)
linewidth = 0.5
if elphmod.MPI.comm.rank == 0:
for n in range(g.shape[1]):
fatband, = elphmod.plot.compline(x, g[:, n], linewidth * w[:, n])
plt.fill(*fatband, linewidth=0.0, color='skyblue')
for n in range(G.shape[1]):
fatband, = elphmod.plot.compline(x, G[:, n], linewidth * W[:, n])
plt.fill(*fatband, linewidth=0.0, color='dodgerblue')
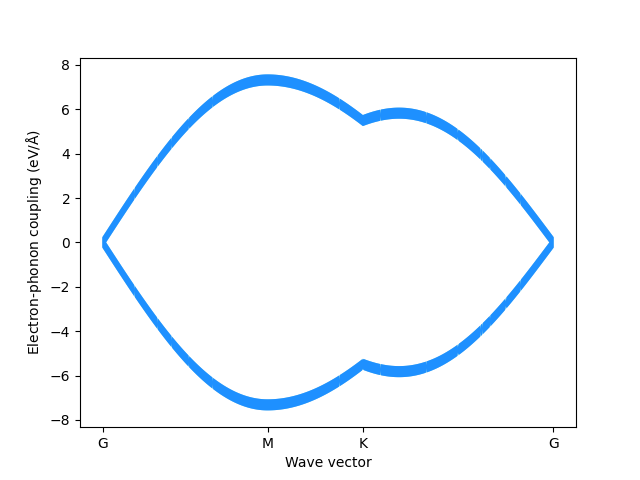
plt.ylabel(r'Electron-phonon coupling ($\mathrm{eV/\AA}$)')
plt.xlabel('Wave vector')
plt.xticks(x[corners], path)
plt.savefig('supercell_elph.png')
plt.show()