#!/usr/bin/env python3
# Copyright (C) 2017-2026 elphmod Developers
# This program is free software under the terms of the GNU GPLv3 or later.
import elphmod
import matplotlib.pyplot as plt
import numpy as np
comm = elphmod.MPI.comm
info = elphmod.MPI.info
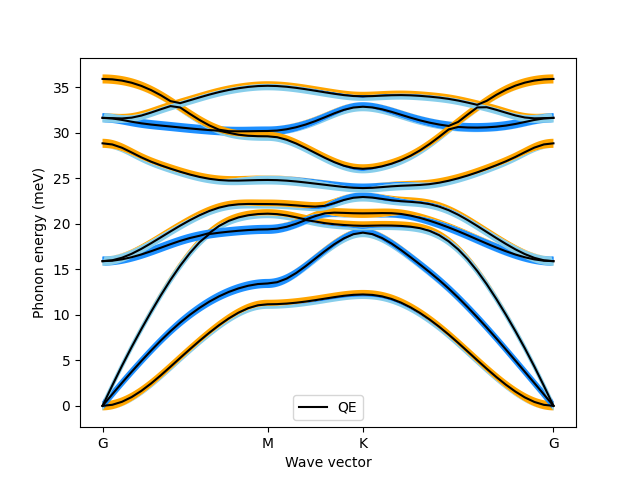
colors = ['skyblue', 'dodgerblue', 'orange']
data = 'NbSe2_cDFPT'
info('Set up mass-spring model')
ph = elphmod.ph.Model('data/%s.ifc' % data, apply_asr_simple=True)
info('Diagonalize dynamical matrix along G-M-K-G')
path = 'GMKG'
q, x, corners = elphmod.bravais.path(path, ibrav=4, N=150)
w2, u, order = elphmod.dispersion.dispersion(ph.D, q,
vectors=True, order=True)
if comm.rank == 0:
w = elphmod.ph.sgnsqrt(w2) * elphmod.misc.Ry * 1e3
pol = elphmod.ph.polarization(u, q)
print("Load reference from Quantum ESPRESSO's 'matdyn.x'")
ref = np.loadtxt('data/%s.disp.gp' % data) * elphmod.misc.cmm1 * 1e3
x0 = ref[:, 0] / ref[-1, 0] * x[-1]
w0 = ref[:, 1:]
print('Plot dispersions')
for nu in range(ph.size):
fatbands = elphmod.plot.compline(x, w[:, nu], pol[:, nu])
for fatband, color in zip(fatbands, colors):
plt.fill(*fatband, color=color, linewidth=0.0)
plt.plot(x0, w0[:, nu], 'k', label='QE' if nu == 0 else None)
plt.ylabel('Phonon energy (meV)')
plt.xlabel('Wave vector')
plt.xticks(x[corners], path)
plt.legend()
plt.savefig('phonons.png')
plt.show()