#!/usr/bin/env python3
# Copyright (C) 2017-2026 elphmod Developers
# This program is free software under the terms of the GNU GPLv3 or later.
import elphmod
import matplotlib.pyplot as plt
import numpy as np
comm = elphmod.MPI.comm
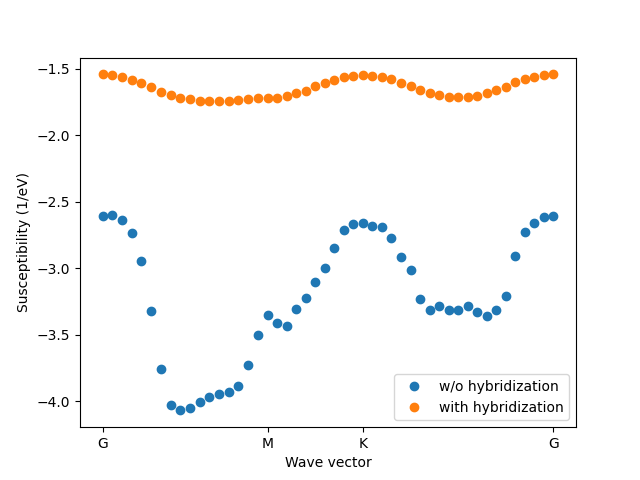
mu = -0.1665
kT = 0.025
q, x, GMKG = elphmod.bravais.GMKG(30, corner_indices=True)
el = elphmod.el.Model('data/NbSe2')
e = elphmod.dispersion.dispersion_full(el.H, 100)[:, :, 0] - mu
chi = elphmod.diagrams.susceptibility(e, kT=kT)
chi_q = elphmod.dispersion.dispersion(chi, q, broadcast=False)
chi_hyb = elphmod.diagrams.susceptibility2(e,
kT=kT, hyb_width=1.0, hyb_height=0.1)
chi_hyb_q = elphmod.dispersion.dispersion(chi_hyb, q, broadcast=False)
if elphmod.MPI.comm.rank == 0:
plt.ylabel('Susceptibility (1/eV)')
plt.xlabel('Wave vector')
plt.xticks(x[GMKG], 'GMKG')
plt.plot(x, chi_q, 'o', label='w/o hybridization')
plt.plot(x, chi_hyb_q, 'o', label='with hybridization')
plt.legend()
plt.savefig('susceptibility_1.png')
plt.show()
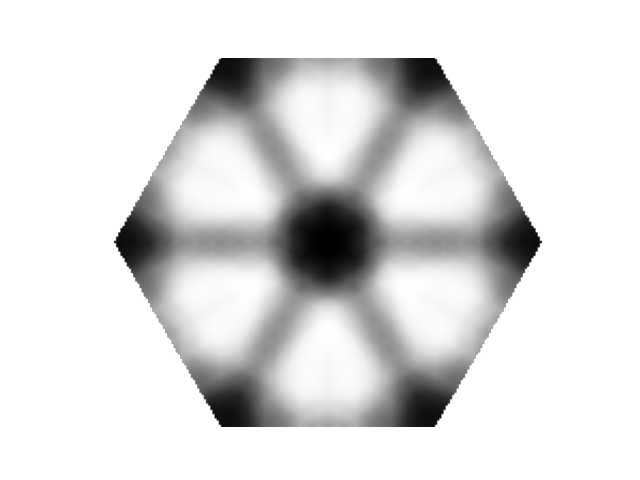
nq = 36
chi_q = elphmod.dispersion.dispersion_full(chi, nq, broadcast=True)[:, :, 0]
BZ = elphmod.plot.toBZ(chi_q, outside=np.nan, angle=120, points=300)
if comm.rank == 0:
plt.imshow(BZ, cmap='Greys')
plt.axis('image')
plt.axis('off')
plt.savefig('susceptibility_2.png')
plt.show()
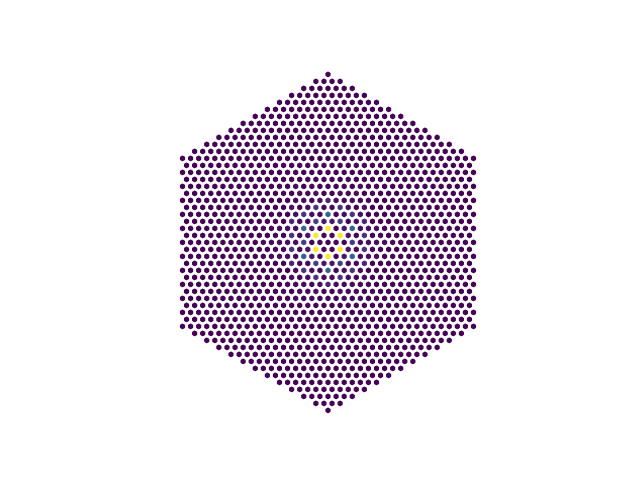
i = np.arange(nq)
transform = np.exp(2j * np.pi / nq * np.outer(i, i)) / nq
chi_R = np.dot(np.dot(transform, chi_q), transform)
chi_R[0, 0] = 0.0
a1, a2 = elphmod.bravais.translations()
points = []
for r1 in range(nq):
for r2 in range(nq):
z = abs(chi_R[r1, r2])
for R1, R2 in elphmod.bravais.to_Voronoi(r1, r2, nq, angle=120):
x, y = R1 * a1 + R2 * a2
points.append((x, y, z))
x, y, z = zip(*points)
if comm.rank == 0:
plt.scatter(x, y, c=z, s=10, marker='h')
plt.axis('image')
plt.axis('off')
plt.savefig('susceptibility_3.png')
plt.show()