#!/usr/bin/env python3
# Copyright (C) 2017-2026 elphmod Developers
# This program is free software under the terms of the GNU GPLv3 or later.
import elphmod.models.graphene
import matplotlib.pyplot as plt
import numpy as np
comm = elphmod.MPI.comm
info = elphmod.MPI.info
info('Define parameters')
to_screen = True
nk = 60
width = 300
height = 300
kT = 0.01
f = elphmod.occupations.fermi_dirac
eta1 = 0.001 # broadening of self-energy
eta2 = 0.0001 # broadening of all modes
# cDFPT dielectric properties:
# https://arxiv.org/src/2102.10072v2/anc/C2/cDFPT.ph
epsxy = 1.37
epsz = 1.16
Z = 0.64
L = 5.0 # cf. Ponce' et al., Phys. Rev. B 107, 155424 (2023)
info('Load model Hamiltonian for graphene')
elphmod.models.graphene.create('data/graphene')
el = elphmod.el.Model('data/graphene')
ph = elphmod.ph.Model('data/graphene.ifc')
elph = elphmod.elph.Model('data/graphene.epmatwp', 'data/graphene.wigner',
el, ph)
el.data /= elphmod.misc.Ry
info('Sample and diagonalize model Hamiltonian')
q, x, GMKG = elphmod.bravais.GMKG(nk, corner_indices=True, mesh=True,
straight=False, lift_degen=False)
e, U = elphmod.dispersion.dispersion_full_nosym(el.H, nk, vectors=True)
D0 = elphmod.dispersion.sample(ph.D, q)
w0 = elphmod.ph.sgnsqrt(np.linalg.eigvalsh(D0))
g = elph.sample(q, U=U, shared_memory=True)
if not to_screen:
ph.lr = True
ph.lr2d = True
ph.eps = np.diag([epsxy, epsxy, epsz])
ph.Z = np.repeat(np.diag([Z, Z, 0.0])[np.newaxis], ph.nat, axis=0)
ph.L = L
ph.prepare_long_range()
G = elph.sample(q, U=U, shared_memory=True)
else:
G = g
info('Calculate retarded displacement-displacement correlation function')
w, dw = np.linspace(0.0, 1.1 * w0.max(), len(q), retstep=True)
Pi0 = elphmod.diagrams.phonon_self_energy(q, e, g=g, G=G, kT=kT, occupations=f)
Piw = elphmod.diagrams.phonon_self_energy(q, e, g=g, G=G, kT=kT, occupations=f,
omega=w + 1j * eta1)
Dw = D0[..., None] - Pi0[..., None] + Piw
A = elphmod.ph.spectral_function(Dw, w, eta2)
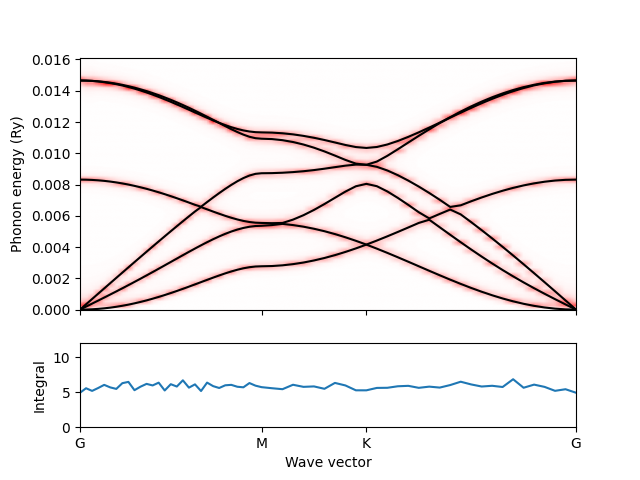
info('Plot results')
maximum = abs(A).max()
integral = A.sum(axis=0) * dw
A = elphmod.plot.adjust_pixels(A, GMKG, x[GMKG], width, height)
if comm.rank == 0:
fig, (ax1, ax2) = plt.subplots(2, 1, sharex=True,
gridspec_kw=dict(height_ratios=(3, 1)))
ax1.set_ylabel('Phonon energy (Ry)')
ax2.set_ylabel('Integral')
ax2.set_xlabel('Wave vector')
ax2.set_xticks(x[GMKG])
ax2.set_xticklabels('GMKG')
ax1.imshow(A[::-1], extent=(x[0], x[-1], w[0], w[-1]),
vmin=-maximum, vmax=maximum, cmap='bwr')
ax1.plot(x, w0, 'k')
ax1.axis('auto')
ax2.plot(x, integral)
ax2.set_ylim(0.0, 2 * ph.size)
plt.savefig('specfun.png')
plt.show()