#!/usr/bin/env python
import ebbw
import numpy as np
import matplotlib.pyplot as plt
from scipy.special import digamma, polygamma
from scipy.integrate import quad
def residue(x, N):
N += 0.5
def integrand(s):
return digamma(N * complex(1, s)).imag / s if s else N * polygamma(1, N)
return 2 / np.pi * quad(integrand, 0, x)[0]
x = np.linspace(0.0, 10.0, 101)
pos = np.where(x >= 1)
figure = plt.figure()
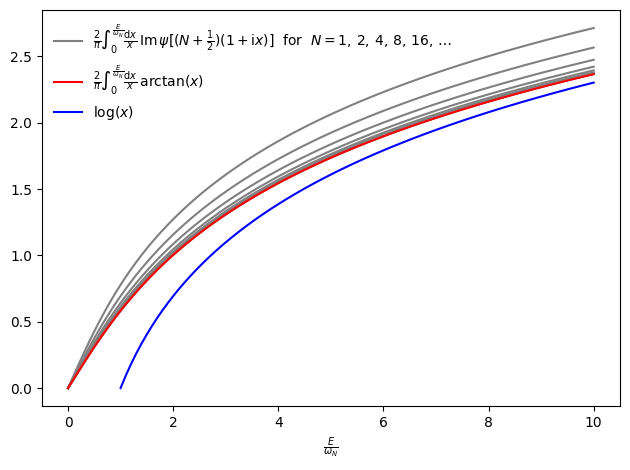
xlabel = r'\frac{E}{\omega_{N}}'
integral = r'\frac{2}{\pi} \int_{0}^{%s} \frac{\mathrm{d} x}{x} \,' % xlabel
for n in range(10):
plt.plot(x, [residue(y, 2 ** n) for y in x], 'gray', label=None if n else
r'$%s \mathrm{Im} \, \psi[(N + \frac{1}{2})(1 + \mathrm{i} x)]$'
r' for $N = 1, \, 2, \, 4, \, 8, \, 16, \, \ldots$' % integral)
plt.plot(x, list(map(ebbw.residue, x)), 'red',
label=r'$%s \arctan(x)$' % integral)
plt.plot(x[pos], np.log(x[pos]), 'blue', label=r'$\log(x)$')
plt.legend(loc='upper left', frameon=False, prop={'size': 'medium'})
plt.xlabel('$%s$' % xlabel)
plt.tight_layout()
figure.savefig('residue.png', bbox_inches='tight')