#!/usr/bin/env python3
import ebbw2
import ebmb
import matplotlib.pyplot as plt
import numpy as np
e, dos = ebmb.box_dos('dos.in', bandwidth=8.0)
shift = False
l = 1.0
w = 0.02
u = 0.2
W = np.linspace(5.0, 25.0, 5)
mu = np.linspace(e[0] + 0.1, e[-1] - 0.1, 11)
T1 = np.empty((len(W), len(mu)))
T2 = np.empty((len(W), len(mu)))
Tc1 = Tc2 = 10.0
for i in range(len(W)):
for j in range(len(mu)):
T1[i, j] = Tc1 = ebmb.get(
program='critical',
conserve=shift,
chi=shift,
T=Tc1,
lamda=l,
omegaE=w,
muC=u,
dos='dos.in',
mu=mu[j],
cutoff=W[i],
)
T2[i, j] = Tc2 = ebbw2.critical(
T=Tc2,
l1=l / 2,
l2=l / 2,
w1=w,
w2=w,
u=u,
E1=mu[j] - e[0],
E2=e[-1] - mu[j],
W=W[i],
)
figure = plt.figure()
for i in range(len(W)):
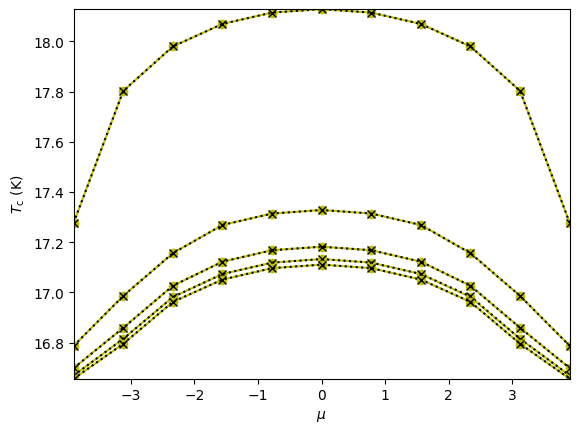
plt.plot(mu, T1[i], 'yo-')
plt.plot(mu, T2[i], 'kx:')
plt.xlabel(r'$\mu$')
plt.ylabel(r'$T_{\mathrm{c}}$ (K)')
plt.autoscale(tight=True)
figure.savefig('ebmb_vs_ebbw.png', bbox_inches='tight')