#!/usr/bin/env python3

import ebmb
import matplotlib.pyplot as plt

e, dos = ebmb.chain_dos('dos.in', de=5e-3, t=1.0)
w, a2f = ebmb.chain_a2F('a2f.in', dw=1e-2, l=1.0, wlog=2.0)

results = ebmb.get(
   realgw=True,
   normal=True,
   conserve=False,
   dos='dos.in',
   a2F='a2f.in',
   lower=-15.0,
   upper=+15.0,
   points=1001,
   logscale=10.0,
   eta=0.01,
   T=300.0,
)

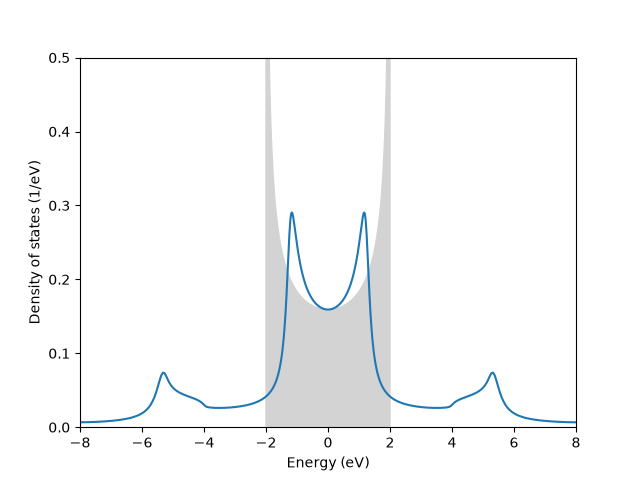
plt.fill_between(e, dos, color='lightgray')
plt.plot(results['omega'], results['DOS'])

plt.xlabel(r'Energy (eV)')
plt.ylabel(r'Density of states (1/eV)')

plt.xlim(-8.0, 8.0)
plt.ylim(0.0, 0.5)

plt.savefig('renorm.png')