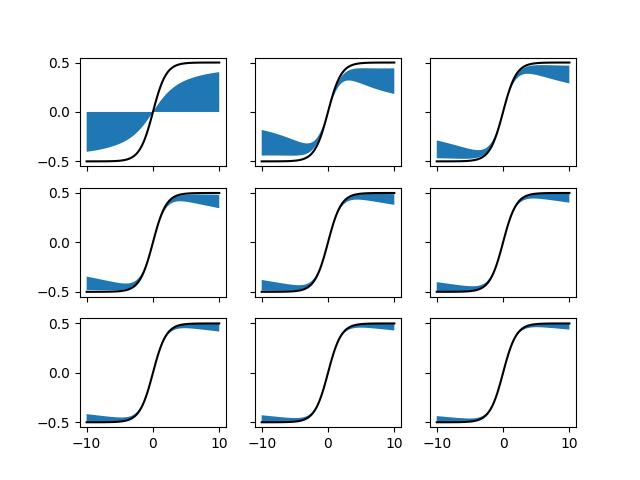
#!/usr/bin/env python3

import numpy as np
import matplotlib.pyplot as plt

x = np.linspace(-10.0, 10.0, 101)

fig, sub = plt.subplots(3, 3)
sub = sub[::-1].flat

for N, ax in enumerate(sub[:-1]):
    summation = sum(1 / (x - 1j * (2 * n + 1) * np.pi)
        for n in range(-N, N)).real + np.zeros_like(x)

    residue = np.arctan2(x, (2 * N + 1) * np.pi) / np.pi

    ax.plot(x, summation, 'k',
        label=r'$\sum_{n = -N}^{N - 1} \frac{1}{x - \mathrm{i} (2 n + 1) \pi}$')

    ax.fill_between(x, summation, summation + residue, color='orange',
        label=r'$\frac{1}{\pi} \arctan \frac{x}{(2 N + 1) \pi}$')

    ax.plot(x, np.tanh(x / 2) / 2, 'k--',
        label=r'$\frac{1}{2} \tanh \frac{x}{2}$')

    ax.text(x[0], 0.5, '$N = %g$' % N, ha='left', va='top')
    ax.set_xlabel(r'$x$')
    ax.label_outer()

sub[-1].legend(*ax.get_legend_handles_labels(), loc='center')
sub[-1].axis('off')

fig.savefig('residue.png')