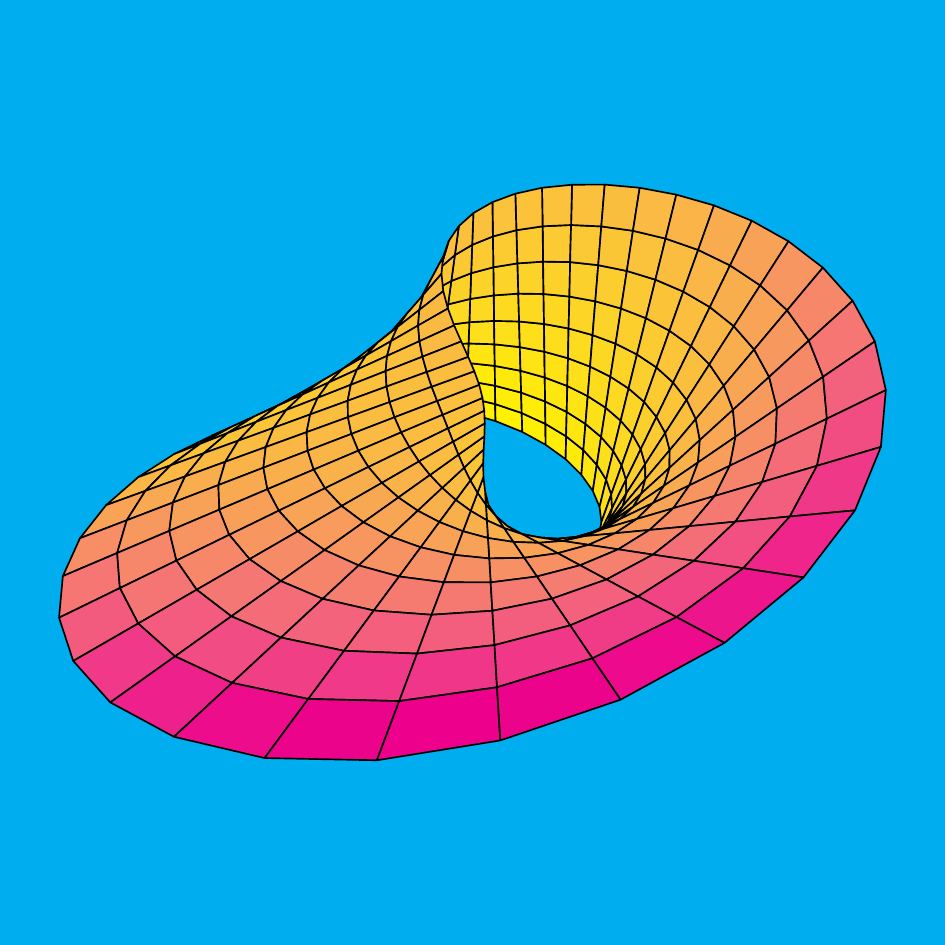
#!/usr/bin/env python3

import numpy as np
import storylines

def moebius(t, u, r=1.0):
    R = r + t * np.cos(u)

    x = R * np.cos(2 * u)
    y = R * np.sin(2 * u)
    z = t * np.sin(u)

    return list(zip(x, y, z))

T = np.linspace(-1.0, 1.0, 10)
U = np.linspace(0.0, np.pi, 40)

objects = []

for u in range(1, len(U)):
    for t in range(1, len(T)):
        objects.append((moebius(
            T[[t, t, t - 1, t - 1, t]],
            U[[u, u - 1, u - 1, u, u]]),
                dict(draw='black', fill=True)))

objects = storylines.project(objects, R=[2.0, 2.0, 2.0])

plot = storylines.Plot(xyaxes=False, height=0.0, margin=0.5, ratio=1.0,
    canvas='cyan', upper='magenta', lower='yellow', colorbar=False)

for R, style in objects:
    x, y, z = zip(*R)
    plot.line(x, y, np.average(z), **style)

plot.save('moebius.png')
