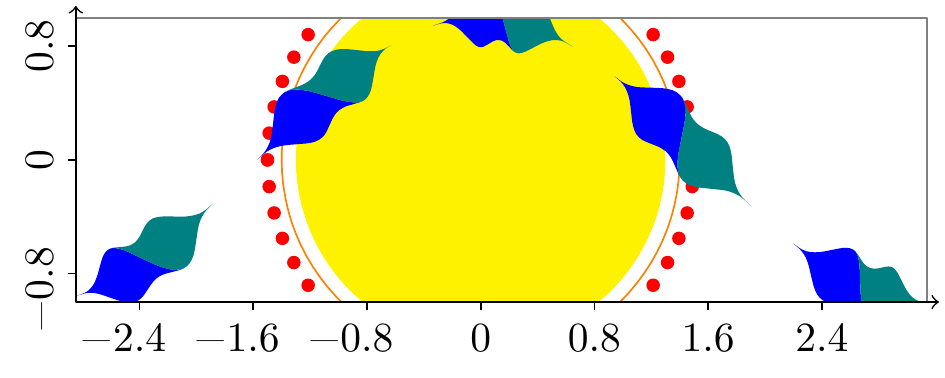
#!/usr/bin/env python3

import numpy as np
import storylines

N = 301

phi = np.linspace(-np.pi, np.pi, N)
x = np.cos(phi)
y = np.sin(phi)

w = np.empty((N, 2))
w[:, 0] = np.maximum(0, np.cos(5 * phi) ** 3) / 2
w[:, 1] = np.maximum(0, np.sin(5 * phi) ** 3) / 2

plot = storylines.Plot(height=0, ymin=-1, ymax=1)

plot.line(1.3 * x, 1.3 * y, draw='none', fill='yellow', cut=True)
plot.line(1.4 * x, 1.4 * y, draw='orange', fill='none', cut=True)
plot.line(1.5 * x[::N // 50], 1.5 * y[::N // 50], color='red', cut=True,
    mark='*', only_marks=True, omit=False)
plot.compline(phi, x, w, colors=['blue', 'teal'], thickness=1.0, cut=True)

plot.axes()

plot.save('fatband.png')
